Generally it is quite simple. Run tests. Count the number of all tests and failed tests and thats it. In most books about Continuous Integration and testing it is written that when some test fails the build is broken. Then just fix it to have still 100% passes and go on. In real projects it is not so simple.
In real projects it is much more complex.
At first there is a lot of tests. Not thousands but tens or hundreds of thousands of tests. In such case it is impossible to reach 100% pass rate. This is against continuous integration rules but this is reality.
Then how could we know that tests run in Continuous Integration process should fail build or not? In such case I think tests results should be read in other way. GO - NO GO is not applicable here.
Another case. If last test run on latest build reports 891 passed tests on 1000 total then what does it mean? Does it mean that it is better or not? It would be good to have previous results. Ok, previous results: 889/1000. So it now looks that it improved?
Still it can be even more complicated. For example: new tests were developed and the total number of tests increased from 1000 to 1020. So which one is better: 889/1000 or 891/1020?
The other case is that while part of tests between two runs did not change their status some small number can change from passed to failed and from failed to passed. So having the same pass rate does not mean that there were no changes in tests' status.
My approach
I was thinking about short indicators that show current status of quality of software. To my mind three came. The first shows current health status, the second - how much work left to achieve 100% quality and the last - a change in tests results.Health Status
This indicator shows current quality of the software. It is number of passed tests to number of all tests i.e. pass rate. Ideal quality is 100% of passing of all tests. So when you look at this number you now relatively to all tests how much is it good.
$latex HS = \frac{P}{T}$ where P - number of tests that passed, T = total number of tests
$latex HS_i = \frac{P_i}{T_i}$ where i - i-th build and tests run
Example: P = 889 T = 1000 HS = 88,9 %
Work Left
So now when I know how good is my software I would like to know how much work left to achieve ideal quality measured by tests pass rate. Work left is measured by number of failing tests. I treat failed test as defect for fix or task to do. Usually one failing test is assigned to one developer for fixing.
$latex WL = F$ where F - number of tests that failed or erred
$latex WL_i = F_i$
Example: P = 889 T = 1000 WL = 111
Change Status
Now I know current status of my software. However there is one thing missing. I do not know what has changed from previous build. This is shown by number of status changes of tests. So I can see if there was any changes in tests even if the pass rate did not change. The number includes also status of tests that were run for the first time.
$latex CS = \Delta P + \Delta F$ where $latex \Delta P$ - number of tests that changed status from failed to passed or were run for the first time and passed, $latex \Delta F$ - number of tests that changed status from passed to failed or were run for the first time and failed or
$latex CS = \Delta P : \Delta F$
Example: $latex \Delta P$ = 1 $latex \Delta F$ = 2 CS = 3 or CS = 1:2
Real life example

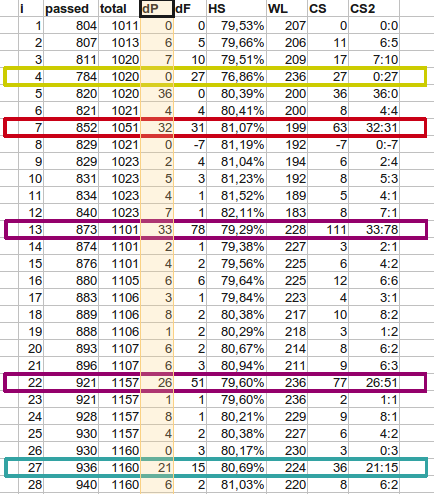
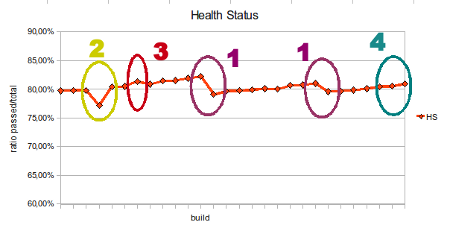
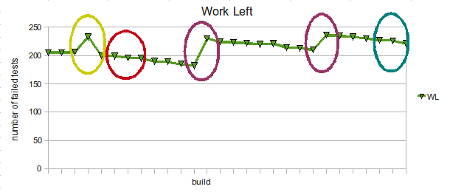
In the table above I prepared nearly real life data. It show about 30 results of tests where total is a little bit more than 1000. In following columns there are: i - build sequence number, passed - number of passed tests, total - number of total run tests, dP - number of tests that have changed status from failed to passed, dF - number of tests that have changed status from passed to failed, HS - Health Status, WL - Work Left, CS - Change Status, CS2 - Change Status in another notation. I injected several cases that can occur in real life described below.

The cases are:
- A bunch of new tests were added. It can be seen in total that has increased from 1023 to 1101 or 1107 to 1157. In charts it is visible as drop in Health Status as there is less known quality than before and Work Left as there is more to do now. On Change Status chart it can be seen as a peak.
- Sudden mass fail. A lot of tests failed in one build but in following build they are passing back.
- Hidden changes. Some tests started passing while similar number of were run for the first time and test are failing. It is not visible on Health Status and Work Left charts. It can be only visible on Change Status chart.
- Hidden changes 2. Some tests failed while similar number of test started passing. It is not visible on Health Status and Work Left charts. Like in previous case, it can be only visible on Change Status chart.


Conclusions
Most test reports include just pass rate. I felt that this is not enough. During thinking about this problem presented indicator came to my mind. Additionally to pass rate i.e. Health Status there should be presented also absolute number of failing tests to show how much Work Left and number of tests that changed status (Change Status) to see if there are any changes that are not shown by previous two indicators
In next articles I will talk about the other type of tests that return only one absolute measurement e.g. results from performance tests and how to detect bad cases (drops in quality, etc.) using Statistical Process Control (SPC) using Quality Control Charts. Having method for discovery of real disasters it can be used in Continuous Integration process.
